Working with Google Visualization Chart in Rails
Working with Google Visualization Chart in Rails
rails 2.3.5 is also comfortable easy to use Google visualisation chart
Step 1: Install the Ruby gem GoogleVisualr...
Enter this Command in Console gem install google_visualr
Step 2: After Completing the install use the “visualr” gem
----------
In Controller Add the following line
@data_table = GoogleVisualr::DataTable.new
Now the data_table object is created and ready for get the chart data
In View Insert the lines
<% data_table=Model.Modelmethod(@data_table)%>
* Model.modelmethod will return the chart data like
<% opts = { :width => 700, :height => 250} %>
<% @chart = GoogleVisualr::Interactive::ColumnChart.new(data_table, opts)%>
<div id='chart'></div>
This Division as id “chart” is replaced by Google Chart from the following line
<%= render_chart(@chart, 'chart') %>
Replace the Chart in the Div id contain the “chart”
Chart Configuration Options are available on this following link :
https://developers.google.com/chart/interactive/docs/gallery/columnchart#Configuration_Options
rails 2.3.5 is also comfortable easy to use Google visualisation chart
Step 1: Install the Ruby gem GoogleVisualr...
Enter this Command in Console gem install google_visualr
Step 2: After Completing the install use the “visualr” gem
----------
In Controller Add the following line
@data_table = GoogleVisualr::DataTable.new
Now the data_table object is created and ready for get the chart data
In View Insert the lines
<% data_table=Model.Modelmethod(@data_table)%>
* Model.modelmethod will return the chart data like
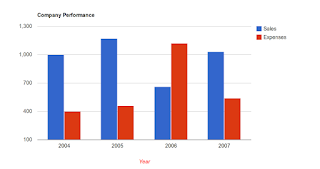
data_table.addColumn('string', 'Year');
data_table.addColumn('number', 'Sales');
data_table.addColumn('number', 'Expenses');
data_table.addRows([
['2004', 1000, 400],
['2005', 1170, 460],
['2006', 660, 1120],
['2007', 1030, 540]
]);
<% opts = { :width => 700, :height => 250} %>
These are the optional properties for the chart
<% @chart = GoogleVisualr::Interactive::ColumnChart.new(data_table, opts)%>
Create chart
<div id='chart'></div>
This Division as id “chart” is replaced by Google Chart from the following line
<%= render_chart(@chart, 'chart') %>
Replace the Chart in the Div id contain the “chart”
Chart Configuration Options are available on this following link :
https://developers.google.com/chart/interactive/docs/gallery/columnchart#Configuration_Options
Ex: Column Chart.

Subscribe to:
Comments
(
Atom
)
No comments :
Post a Comment